

Time for a Grade Audit!
Most schools around the country (and globe) are right about at the end of the first quarter. Now, 1/4 of the way through the year, is a great time to ask yourself if the grades you’re giving out to students reflect your values?
Well, actually, your grades are your values. The marks your students receive are a reflection of what the teachers value.
This is a good time to see if your vision is matching reality.
Let’s see what a grade audit would look like depending on your grade level.
MTSS or RTI
If you’re using an RTI or MTSS model, you should probably expect to see about 80-95% of your student with B’s & A’s. About 10-20% could be in C-D range and only about 5-10% should be receiving F’s.

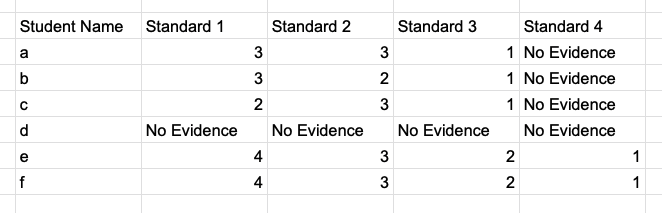
Standards-based Grading
If you’re grading based on end-of-year grade level standards, you likely would be seeing low scores now on most of your standards because the year just started.
That is if you are actually entering evidence or scores which you may not be, yet. For example, if you’re teaching Pythagorean theorem later this year, you would have no evidence entered right now.
If you’ve touched on it, but haven’t gone deep into it, you might have some evidence of kids achieving it, but maybe not. You might also see some kids with evidence of things you haven’t covered yet, which is not a bad thing. At least now you can start making some plans for how to address these students when you get to that content.
It is possible that could have No Evidence for a student for the whole first quarter. That would be more appropriate than an F with 5%, but still there are major concerns that would need to be addressed.
Bell curve
If you’re grading on a bell curve, you shoul see about the same number of kids with F’s as you do A’s. This isn’t a great practice, but it is better than the inverse bell curve or YouTube grading, which only has thumbs up or thumbs down.

YouTube Grading Or Inverse Bell Curve
You know how on YouTube there are thumbs up and thumbs down for rating videos. It’s all or nothing for those videos, and some classes are like this also. You’ll see the vast majority of kids with either an A or an F, and very little in between. So, what can you interpret from these grades? In my experience, I typically can interpret that the teacher has a mindset set of, “It’s my job to teach, and the student’s job to learn [in the way I teach it].” What you’ll often see are students with grades that are either incredibly low, I’m talking single digit percentage F grades or just barely not a D-, something like 58.5%.

Other Considerations
You might have some teachers in your school that are giving out a lot of F's. Is there a teacher that may have way more F's than other students.
One thing you can do is determine what percentage of her students have an F, and see what that looks like. If it's above 5%, it's worth a conversation. If it's above 25%, you've got some major problems that you really need to address.
Another concern is if every student has 100%. You might want to look into that, too.
Conclusion
One thing that I always tell my teachers when I’m in a traditional grading school is “F means the teacher failed, D means the student failed.”
As a parent, seeing an F on my child’s report card means that my child’s teacher has written them off and given up on them.

